


Contents
What is an electroencephalogram (EEG)?
What is quantitative electroencephalogram (QEEG)?
How and why is QEEG used in Neurofeedback?
How is QEEG performed?
What is in a QEEG report?
How do you interpret a QEEG report?
Do QEEGs differ among practitioners?
Has QEEG been scientifically validated?
How much does QEEG cost?
Sample QEEG Reports:
Parkinson's diseases misdiagnosed. [PDF]
Possible radiation disease. [PDF]
ADHD and hypersympathecotonia. [PDF]
Synchronized mu and left sided weakness. [PDF]
What is an electroencephalogram (EEG)?
It has been known since at least the late 1800s that the brain produces electricity. In 1929 Hans Berger published the first modern-looking tracing of a brain wave and he identified the most prominent waves that occurred with the conditions of eyes closed and eyes opened. “Alpha” was the name given to those brain waves that were most prominent with eyes closed. The electrical alpha waves changed polarity between 8 to 12 Hertz (Hz) (times per second). By the 1930s investigators were learning to identify patterns associated with sleep, epilepsy, coma, brain infection and other conditions. Despite the invention in the late 1900s of other types of scans (MRI, CT, SPECT, PET), the EEG has remained a crucial clinical and research tool. And unlike other types of scans it does not require that the patient be exposed to external radiation or be injected with radioactive tracers. Until about the 1970s EEGs were recorded using ink on rolling paper with a device the size of a small desk. Usually 19 sensors are applied to standard locations on the scalp.What is a quantitative electroencephalogram (QEEG)?
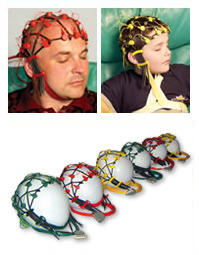
Starting in the 1970s it became possible to store the EEG signals on computer media for later analysis. As computers and electronic amplifiers became smaller and faster, and as mathematical methods developed, it has become possible to store 19 or more channels of EEG data on a laptop computer using an amplifier the size of hardback book. Often the sensors are attached to the inner surface of a cloth or mesh cap. The caps come in various sizes so that the sensors will be accurately placed on any size head. The computer is capable of recognizing many more and subtle patterns among the brain waves in various locations than the eye can normally see. These patterns are then graphically displayed as colored brain maps, tables, and charts. Despite the impressive ability to detect subtle significant patterns, the raw EEG must always be analyzed by a trained eye in order to avoid misinterpretation or ambiguity in the QEEG. A very special feature of modern QEEG is that all the data from a client's recording can be compared to several databases of 'normal' individuals brainwaves. This makes it much easier to spot statistically significant deviations. These deviations may or not be clinically significant. It is important to consider them in light of any complaints or conditions the client might have in order to better appreciate their significance, if any.How and why is QEEG used in Neurofeedback?
Much of the groundbreaking work in neurofeedback was done without the aid of QEEG. Many practitioners still use protocols that are generally but not always safe and provide the ability for most brains to develop flexibility and increased control. Studies (references to come) have suggested that for some populations qEEG-driven neurofeedback is more effective. The differences between what are commonly called EEG and QEEG is that EEG reading always involves deep attention to the raw EEG and perhaps a few quantified metrics such as peak frequency. This is the form most commonly used in hospitals and neurology practices. Neurofeedback and research have particular interest in maps and charts that are completely made from mathematical measurements on the raw EEG. These so-called QEEG brain maps are often useful in developing strategies for neuromodulation.How is QEEG performed?
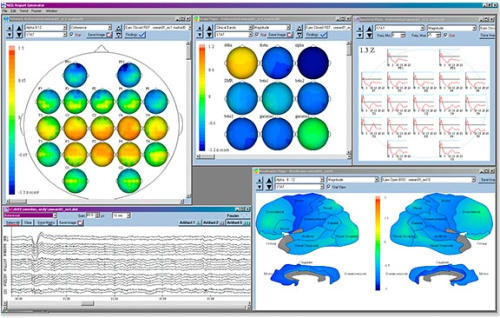
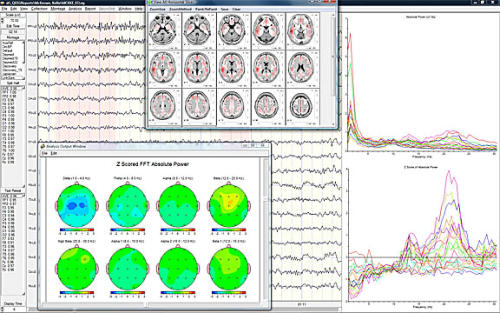
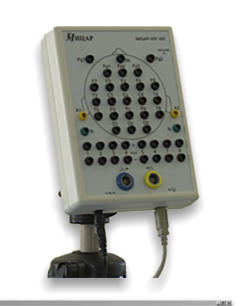
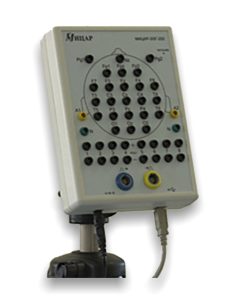
The client's head is measured to determine which size sensor cap will be used. I use the "Comby Caps" by Pamel in Croatia www.pamel.hr. They are comfortable and it is easy and quick to prepare them to record a high-quality signal. The cap is plugged into a 32 channel Mitsar amplifier which is controlled by the WinEEG software www.novatecheeg.com. The sensors in the cap are optically isolated from the power to avoid any risk of shock. Once the EEG is obtained it can be analyzed further with the WinEEG software and the Human Brain Index database www.mitsar-medical.com or exported to be analyzed with the Neuroguide database www.appliedneuroscience.com or the Sterman-Kaiser SKIL database www.skiltopo.com. The cap and its sensors must be positioned according to the International 10-20 system; the sensors must be prepped with special conductive gel and the connection of each sensor with the scalp must be tested; the client must be comfortable and watched for any unnecessary movements of body or hardware. Some time after capturing the EEG recording, it must be carefully examined by eye in order to judge its quality and any gross indicators of problems. If the goal is to compare complex measurements of the client’s EEG with those of a database of expected values, then it will be necessary to carefully isolate just those sections of the recording that are free of “artifacts”. An artifact refers to a signal embedded in the scalp recording that comes from movement or the environment or is otherwise not related to brain electrical produced by a non-drowsy brain in a resting state. Usually such recordings include one or more taken with 1) eyes opened, 2) eyes closed and sometimes 3) during a task such as reading or calculating. Below are photographs of equipment and software used to gather and analyze EEG.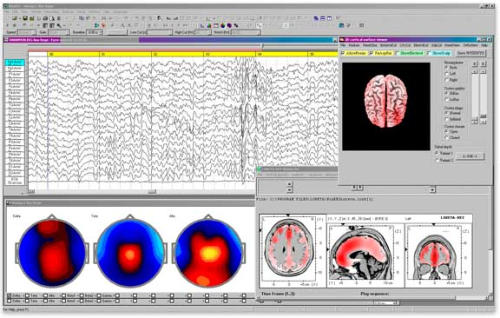
.
What is in a QEEG report?
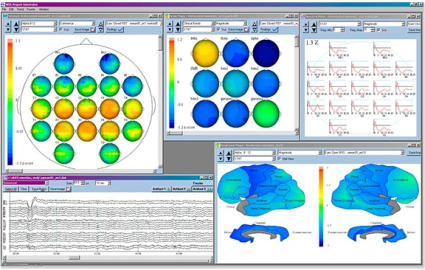
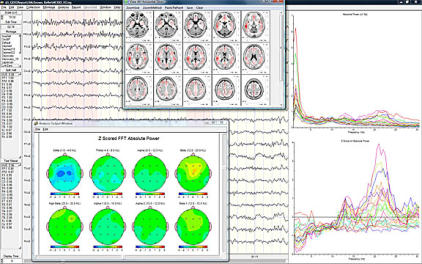
You can see some of my sample QEEG reports by returning to the index at the top of this page. QEEG reports typically run from 8 to 30 or more pages in length. Usually there is a brief description of the client, the methods used to collect the EEG and prepare the report, a description of the quality of the recording, a description of the findings (normal and abnormal) and then an interpretative report. Even a single channel of EEG can be analyzed quantitatively and yield a qEEG report. However, most textbooks on clinical EEG interpretation are based on 19 channels of EEG. The most commonly used QEEG amplifiers use at least 19 channels. There are several types of brain activity shown in the description of findings. For each of the 19 electrodes you can see the voltage and power measurements and you can compare them with the voltages and powers of each of the 18 other cortical areas. For each pair of electrodes, whether close together or far apart, you can see several measurements (coherence, comodulation, phase) that describe communications between the two areas. These are often called network measurements. Incidentally, while there are 19 electrodes (and associated cortical areas) that can be measured individually (for example for amplitude, or spectral content, or complexity), there are 171 ways you can select pairs of electrodes in a 19-channel electrode cap. From each of those 171 pairs you can generate network measurements, most commonly coherence, phase and commodulation. Each of these calculations is repeated for the different clinical frequency bands of interest. Each of the usual clinical frequency bands is described in terms of its range of frequencies in Hertz (Hz) (the Hertz is a unit meaning cycles per second). The usual bands are: 1) Delta (1-4 Hz), 2) Theta (4-8 Hz), 3) Alpha (8-12 Hz); 4) SMR (12-15 Hz); 5) Beta (12 Hz and above), and 6 ) Gamma (35 Hz and above). The bands are often subdivided into smaller bands (e.g., Alpha Lo, Alpha Hi, Beta Lo, Beta Med, Beta Hi) according to the needs of the investigator. These findings are displayed in a variety of formats such as tables, graphs, charts, and colored topographic maps. It is the appearance of the topographic maps that has lead to the term brain mapping to describe this entire procedure. All the amplitude findings and the network findings for all the frequency bands of interest are then compared to one or more of several commercially published databases to see how far away from "normal" they are. The maps also provide a more visual way to think about information processing in the distributed networks.How do you interpret a QEEG report?
The report usually has a section describing the appearance of the raw EEG. It is important that the any appearance of epileptiform activity be noted. The raw EEG may represent shifts between states such as drowsiness which should not appear on the maps because they have been ignored as artifact. Several well- defined raw EEG phenotypes exist which can be useful clinically. The maps show functional data in a spatial pattern that makes it easier to visualize network structure and function. Asymmetries, focal disturbances, and regions of increased or decreased communication can be seen from these maps. The data which generated the maps and tables can also be compared with expected values in database of similar aged “normals”. The report indicates the likelihood that the client’s particular cortical functions would be found at random in a database of normals. This information may be useful to a physician to corroborate other findings. It may be useful to the neurofeedback practitioner in order to develop protocols.Do QEEGs differ among practitioners?
Currently, very few neurofeedback practitioners do their own full QEEGS. Often the price of the hardware and software is $15,000 or more. The extra training and experience is also a huge commitment. Most neurofeedback practitioners will still do a mini QEEG which can be as simple as an analysis of the amplitudes of various brain wave frequencies measured at a few sites on the scalp. Currently, the EEG amplifiers most commonly used for neurofeedback are the Mitsar, Nexus, Deymed, Discovery, Caldwell, Lexicor, and a few others. The appearance of the report will differ with the software that is used. In general, doing database comparisons increases the size of the report. Some reports include an interpretation of the data in terms of known or suspected neurocognitive mechanisms in similar clients.Has QEEG been scientifically validated?
First it must be said that QEEG is an add-on to standard EEG. One has only to search the databases, such as the U.S. National Institute of Health at www.pubmed.gov to verify that tens of thousands of scientific studies have been done concerning quantitative EEG interpretation. What is sometimes questioned is the possible over- reliance of some neurofeedback practitioners on the QEEG to diagnose and/or manage clients.How much does QEEG cost?
A recording and analysis with neurofeedback recommendations costs $500.Are you considering having a QEEG done?
If you already have a neurofeedback practitioner then it is important that she or he receives a QEEG that provides the information necessary to develop your neurofeedback protocol. If you have visited this page through an outside link, then you may be interested in my companion websites, tagsync.com and livecomplexitytraining.com.


QEEG
Quantitative Electroencephalography


Contents
What is an electroencephalogram (EEG)?
What is quantitative electroencephalogram (QEEG)?
How and why is QEEG used in Neurofeedback?
How is QEEG performed?
What is in a QEEG report?
How do you interpret a QEEG report?
Do QEEGs differ among practitioners?
Has QEEG been scientifically validated?
How much does QEEG cost?
Sample QEEG Reports:
Parkinson's diseases misdiagnosed. [PDF]
Possible radiation disease. [PDF]
ADHD and hypersympathecotonia. [PDF]
Synchronized mu and left sided weakness. [PDF]
What is an electroencephalogram (EEG)?
It has been known since at least the late 1800s that the brain produces electricity. In 1929 Hans Berger published the first modern-looking tracing of a brain wave and he identified the most prominent waves that occurred with the conditions of eyes closed and eyes opened. “Alpha” was the name given to those brain waves that were most prominent with eyes closed. The electrical alpha waves changed polarity between 8 to 12 Hertz (Hz) (times per second). By the 1930s investigators were learning to identify patterns associated with sleep, epilepsy, coma, brain infection and other conditions. Despite the invention in the late 1900s of other types of scans (MRI, CT, SPECT, PET), the EEG has remained a crucial clinical and research tool. And unlike other types of scans it does not require that the patient be exposed to external radiation or be injected with radioactive tracers. Until about the 1970s EEGs were recorded using ink on rolling paper with a device the size of a small desk. Usually 19 sensors are applied to standard locations on the scalp.What is a quantitative electroencephalogram (QEEG)?
Starting in the 1970s it became possible to store the EEG signals on computer media for later analysis. As computers and electronic amplifiers became smaller and faster, and as mathematical methods developed, it has become possible to store 19 or more channels of EEG data on a laptop computer using an amplifier the size of hardback book. Often the sensors are attached to the inner surface of a cloth or mesh cap. The caps come in various sizes so that the sensors will be accurately placed on any size head. The computer is capable of recognizing many more and subtle patterns among the brain waves in various locations than the eye can normally see. These patterns are then graphically displayed as colored brain maps, tables, and charts. Despite the impressive ability to detect subtle significant patterns, the raw EEG must always be analyzed by a trained eye in order to avoid misinterpretation or ambiguity in the QEEG. A very special feature of modern QEEG is that all the data from a client's recording can be compared to several databases of 'normal' individuals brainwaves. This makes it much easier to spot statistically significant deviations. These deviations may or not be clinically significant. It is important to consider them in light of any complaints or conditions the client might have in order to better appreciate their significance, if any.How and why is QEEG used in Neurofeedback?
Much of the groundbreaking work in neurofeedback was done without the aid of QEEG. Many practitioners still use protocols that are generally but not always safe and provide the ability for most brains to develop flexibility and increased control. Studies (references to come) have suggested that for some populations qEEG-driven neurofeedback is more effective. The differences between what are commonly called EEG and QEEG is that EEG reading always involves deep attention to the raw EEG and perhaps a few quantified metrics such as peak frequency. This is the form most commonly used in hospitals and neurology practices. Neurofeedback and research have particular interest in maps and charts that are completely made from mathematical measurements on the raw EEG. These so-called QEEG brain maps are often useful in developing strategies for neuromodulation.How is QEEG performed?
The client's head is measured to determine which size sensor cap will be used. I use the "Comby Caps" by Pamel in Croatia www.pamel.hr. They are comfortable and it is easy and quick to prepare them to record a high- quality signal. The cap is plugged into a 32 channel Mitsar amplifier which is controlled by the WinEEG software www.novatecheeg.com. The sensors in the cap are optically isolated from the power to avoid any risk of shock. Once the EEG is obtained it can be analyzed further with the WinEEG software and the Human Brain Index database www.mitsar-medical.com or exported to be analyzed with the Neuroguide database www.appliedneuroscience.com or the Sterman-Kaiser SKIL database www.skiltopo.com. The cap and its sensors must be positioned according to the International 10-20 system; the sensors must be prepped with special conductive gel and the connection of each sensor with the scalp must be tested; the client must be comfortable and watched for any unnecessary movements of body or hardware. Some time after capturing the EEG recording, it must be carefully examined by eye in order to judge its quality and any gross indicators of problems. If the goal is to compare complex measurements of the client’s EEG with those of a database of expected values, then it will be necessary to carefully isolate just those sections of the recording that are free of “artifacts”. An artifact refers to a signal embedded in the scalp recording that comes from movement or the environment or is otherwise not related to brain electrical produced by a non-drowsy brain in a resting state. Usually such recordings include one or more taken with 1) eyes opened, 2) eyes closed and sometimes 3) during a task such as reading or calculating. Below are photographs of equipment and software used to gather and analyze EEG.
.
What is in a QEEG report?
You can see some of my sample QEEG reports by returning to the index at the top of this page. QEEG reports typically run from 8 to 30 or more pages in length. Usually there is a brief description of the client, the methods used to collect the EEG and prepare the report, a description of the quality of the recording, a description of the findings (normal and abnormal) and then an interpretative report. Even a single channel of EEG can be analyzed quantitatively and yield a qEEG report. However, most textbooks on clinical EEG interpretation are based on 19 channels of EEG. The most commonly used QEEG amplifiers use at least 19 channels. There are several types of brain activity shown in the description of findings. For each of the 19 electrodes you can see the voltage and power measurements and you can compare them with the voltages and powers of each of the 18 other cortical areas. For each pair of electrodes, whether close together or far apart, you can see several measurements (coherence, comodulation, phase) that describe communications between the two areas. These are often called network measurements. Incidentally, while there are 19 electrodes (and associated cortical areas) that can be measured individually (for example for amplitude, or spectral content, or complexity), there are 171 ways you can select pairs of electrodes in a 19-channel electrode cap. From each of those 171 pairs you can generate network measurements, most commonly coherence, phase and commodulation. Each of these calculations is repeated for the different clinical frequency bands of interest. Each of the usual clinical frequency bands is described in terms of its range of frequencies in Hertz (Hz) (the Hertz is a unit meaning cycles per second). The usual bands are: 1) Delta (1-4 Hz), 2) Theta (4-8 Hz), 3) Alpha (8-12 Hz); 4) SMR (12-15 Hz); 5) Beta (12 Hz and above), and 6 ) Gamma (35 Hz and above). The bands are often subdivided into smaller bands (e.g., Alpha Lo, Alpha Hi, Beta Lo, Beta Med, Beta Hi) according to the needs of the investigator. These findings are displayed in a variety of formats such as tables, graphs, charts, and colored topographic maps. It is the appearance of the topographic maps that has lead to the term brain mapping to describe this entire procedure. All the amplitude findings and the network findings for all the frequency bands of interest are then compared to one or more of several commercially published databases to see how far away from "normal" they are. The maps also provide a more visual way to think about information processing in the distributed networks.How do you interpret a QEEG report?
The report usually has a section describing the appearance of the raw EEG. It is important that the any appearance of epileptiform activity be noted. The raw EEG may represent shifts between states such as drowsiness which should not appear on the maps because they have been ignored as artifact. Several well-defined raw EEG phenotypes exist which can be useful clinically. The maps show functional data in a spatial pattern that makes it easier to visualize network structure and function. Asymmetries, focal disturbances, and regions of increased or decreased communication can be seen from these maps. The data which generated the maps and tables can also be compared with expected values in database of similar aged “normals”. The report indicates the likelihood that the client’s particular cortical functions would be found at random in a database of normals. This information may be useful to a physician to corroborate other findings. It may be useful to the neurofeedback practitioner in order to develop protocols.Do QEEGs differ among practitioners?
Currently, very few neurofeedback practitioners do their own full QEEGS. Often the price of the hardware and software is $15,000 or more. The extra training and experience is also a huge commitment. Most neurofeedback practitioners will still do a mini QEEG which can be as simple as an analysis of the amplitudes of various brain wave frequencies measured at a few sites on the scalp. Currently, the EEG amplifiers most commonly used for neurofeedback are the Mitsar, Nexus, Deymed, Discovery, Caldwell, Lexicor, and a few others. The appearance of the report will differ with the software that is used. In general, doing database comparisons increases the size of the report. Some reports include an interpretation of the data in terms of known or suspected neurocognitive mechanisms in similar clients.Has QEEG been scientifically validated?
First it must be said that QEEG is an add-on to standard EEG. One has only to search the databases, such as the U.S. National Institute of Health at www.pubmed.gov to verify that tens of thousands of scientific studies have been done concerning quantitative EEG interpretation. What is sometimes questioned is the possible over-reliance of some neurofeedback practitioners on the QEEG to diagnose and/or manage clients.How much does QEEG cost?
A recording and analysis with neurofeedback recommendations costs $500.Are you considering having a QEEG done?
If you already have a neurofeedback practitioner then it is important that she or he receives a QEEG that provides the information necessary to develop your neurofeedback protocol. If you have visited this page through an outside link, then you may be interested in my companion websites, tagsync.com and livecomplexitytraining.com.


QEEG
Quantitative Electroencephalography

